There are a large variety of techniques that can be employed when conducting research or an evaluation for a user experience (UX) project – This blog post aims to describe some of the more advanced techniques that are commonly used, and what the role and usefulness of each technique has on UX design. The proceeding sections will take a look at the following advanced techniques:
- Eye tracking
- Analytics
- Statistical analysis
The first technique, eye tracking, can be used to unearth key insights not easily discovered by the more traditional evaluation methods.
Eye tracking
As already noted above, traditional evaluation methods do not pick up on the detailed information that an advanced evaluation technique such as eye tracking studies do naturally, and provide a somewhat incomplete picture. Eye tracking studies can be leveraged to help understand how users consume content (Kaushik, 2009), what happens between interaction events, and answer questions like the following (Lazar, Feng, & Hochheiser, 2009):
- Did the user hesitate before making the selection that they ended up making?
- What did they look at on the screen before making a particular selection?
- Which portions of the user interface (UI) initially attracted the user’s attention?
While reading questions like these might make the integration of eye tracking studies into the everyday evaluation process sound like a complete no-brainer, Lazar et al. (2009) indicate that eye tracking studies are not without their flaws – Commercial eye tracking systems have been found to be expensive, difficult to use and interpret the data, cumbersome, and require individual configuration for each participant.
With these shortcomings in mind, according to Bojko (2013) there are three questions that should be asked when justifying whether an eye tracking study is an appropriate addition during a UX project:
- Will eye tracking generate actionable insight that addresses the study objectives?
- Is eye tracking the simplest method to answer the research questions?
- Does the study need a buy-in boost?
Posing these kinds of questions provide the opportunity for determining whether the investment in conducting an eye tracking study is worth it. To understand what kind of actionable insight eye tracking studies can generate, Bojko (2013) developed the diagram seen in Figure 1 below:
It’s possible from the figure above to discern that eye tracking studies can benefit formative research by providing information that improves design recommendations. Bojko (2013) indicates that in both detecting and explaining usability problems, eye tracking studies can answer questions such as:
- Why did the study participants make an incorrect action?
- Why did the correct action take longer than expected?
- Why did participants fail to extract certain information?
Speaking from experience, the effort in producing business justification for conducting an eye tracking study is quite difficult based on the return of investment and value it provides – Until it becomes a more viable option, some success has been found in leveraging alternative methods, such as Lookback, which provides the ability to record UI behaviour and interaction, as well as the participant’s face and voice.
It’s clear that eye tracking studies provide a rewarded UX insight not found via other evaluation methods – As such, it can be a high-cost, high-reward endeavour (Lazar et al., 2009). Analytics is another advanced technique that can be leveraged to gain user-centered insights, with less investment than that of eye tracking studies.
Analytics
Somewhat cheaper and quicker to implement than eye tracking studies, analytics can be leveraged in UX design to evaluate user traffic on a website. This is typically achieved by logging user interaction and behaviour remotely, and then analysing that data to infer what areas of an UI are being used as well as at what frequency (Rogers, Sharp, & Preece, 2012).
Drawing from experience, the most commonly-used method for gaining insights from analytics is through Google’s Analytics solution – Google’s service advertises the opportunity to improve business performance through better digital measurement of actionable data (Cutroni, Seiden, & Foxworth, n.d.), as well as high-powered reports that can provide insights into traffic sources, landing pages, and desired goals (Kaushik, 2013).
According to Peyton (2014), the most inquired metric from Google Analytics is bounce rate, which can be described as the percentage of single interaction visits with an UI – Depending on it’s purpose, the baseline for a ‘good’ bounce rate can vary from UI to UI.
Through what is sometimes called ‘data-driven design’ (Rodden, 2015), usage data in Google Analytics can be leveraged to both strengthen a product’s content strategy (Bloomstein, 2012), information architecture (Morville, Arango, & Rosenfeld, 2015), as well as compare a selection of alternative UI options using a validation method called A/B testing (see Figure 2 below), in which two UIs are randomly served to a predetermined percentage of people who visit it (Kaushik, 2009).
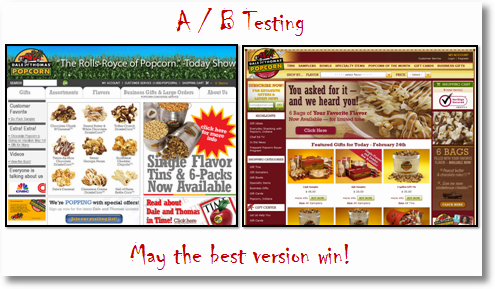
A/B testing can be adopted in UX design in order to validate desired goals or outcomes for a proposed UI against it’s current manifestation, typically with the aim of achieving more click-throughs, conversions, or donations, and lower bounce rates. As mentioned before, A/B testing may be the cheapest way to begin evaluating due to it’s inherent simplicity, quick accessibility to the tools, and the fact that insights gleaned from it are both actionable and easy to communicate to stakeholders (Kaushik, 2009).
In practice, A/B testing an UI requires the need to be very attentive and specific to what is being tested – It’s important that changes to the elements of the UI are both isolated and targeted, in order to determine what contributed to the results of the evaluation.
As they’re not obviously bound to the conversion rate of an UI and are harder to detect, micro conversions, which measure the impact of incremental UX improvements, are often overlooked in analytics (Cardello, 2014). A group of quantitative researchers at Google developed a framework to help choose and define appropriate metrics that reflect the quality of user experience, entitled the HEART framework, which focuses on the following measurements (Rodden, 2015):
- Happiness
- Engagement
- Adoption
- Retention
- Task success
The above categories provides the opportunity to devise user experience targets around the insights produced from analytics and translate them into goals that can either be tracked over time or used for comparison in A/B testing (Rodden, 2015).
In closing, analytics can provide a cheap and quick solution for getting started with evaluating an UI, but shouldn’t be relied on too heavily as it may mean that UI revisions are not being produced quick enough – Statistical analysis is the final advanced technique that will be discussed, in particular the benefits and impact that it can have on the UX design process.
Statistical analysis
Design researchers have a vast toolkit of research methods at their disposal – These can include field studies, focus groups, interviews, observations, questionnaires, usability studies, and even experimental research through controlled experiments (Lazar, Feng, & Hochheiser, 2009).
Experimental research, usually comparative in nature (MacKenzie, 2013), can identify the cause of a situation or set of events (Lazar et al., 2009) – in order to do this, it typically leverages common methods of statistical analysis such as an one-way analysis of variance (ANOVA) or a t test (SPSS Tutorials, n.d.), illustrated in Figure 3, the most widely used test in human-computer interaction (HCI) (Rogers et al., 2012), to determine whether there is a statistically significant difference between the means of different variables in a UI (Lund, 2013).
In the context of UX design, statistical analysis can, for example, help determine whether there is any difference in the time spent locating different sections of a UI when either a popup or pull down menu has been applied to it. Some examples of dependent and independent variables in the context of UX design are as follows (Lazar et al., 2009):
- Dependent variables – Accuracy, efficiency, and satisfaction
- Independent variables – Different types of design, devices, or technology
Popular software like IBM SPSS provides a powerful suite of tools for addressing the entire analytical process including data collection, analysis, and reporting (IBM, n.d.) – Software like this extremely valuable as for most people statistics is just a useful tool, and understanding the detailed mathematical basis of a statistical test is unnecessary (McDonald, 2014).
As well as this, it has been documented that it’s quite common for those working in the field to have not received any training in statistical analysis, leaving some of the statistical tests utilised in experimental research to look questionable (Yatani, 2014).
Diverging further from traditional statistical analysis methods, it also appears that there has been some traction in raising awareness around the dangers of null hypothesis significance testing, and how it may no longer be necessary when dealing with HCI (Dragicevic, Chevalier, Huot, Jansen, Willet, Perin, Isenberg, Isenberg, Boy, & Bertini, 2016).
Eye tracking, analytics, and statistical analysis can all provide valuable insights throughout the UX design process. For each of these advanced evaluation techniques, there can be a different requirement for implementation – whether it’s finance, resources, or time, like all things it’s important to understand whether the return value is worth the investment spent on pursuing these avenues for evaluation.
References
Bloomstein, M. (2012). Content Strategy at Work: Real-world stories to strengthen every interactive project (First ed.). Morgan Kaufmann.
Bojko, A. (2013). Eye Tracking the User Experience: A Practical Guide to Research. Rosenfeld Media.
Cardello, J. (2014, March 14). Define micro conversions to measure incremental UX improvements. Retrieved October 12, 2016, from Nielsen Norman Group, https://www.nngroup.com/articles/micro-conversions
Cutroni, J., Seiden, K., & Foxworth, F. (n.d.). Analytics Academy. Retrieved October 12, 2016, from Google Analytics Academy, https://analyticsacademy.withgoogle.com
Cutroni, J., Seiden, K., & Foxworth, F. (n.d.). Digital Analytics Fundamentals. Retrieved October 14, 2016, from Google Analytics Academy, https://analyticsacademy.withgoogle.com/course/1
Dragicevic, P., Chevalier, F., Huot, S., Jansen, Y., Willet, W., Perin, C., Isenberg, P., Isenberg, T., Boy, J., & Bertini, E. (2016, December 17). Bad Stats: Not What It Seems. Retrieved December 18, 2016 from http://www.aviz.fr/badstats
IBM. (n.d.). IBM SPSS – IBM Analytics. Retrieved December 15, 2016, from http://www.ibm.com/analytics/us/en/technology/spss/
Kaushik, A. (2013, January 2). Google Analytics tips: 10 data analysis strategies that pay off big! Retrieved October 12, 2016, from Advanced Analytics, http://www.kaushik.net/avinash/google-analytics-tips-data-analysis-reports
Kaushik, A., (2009). Web Analytics 2.0: The Art of Online Accountability & Science of Customer Centricity. Wiley Publishing.
Lazar, J., Feng, J.H., & Hochheiser, H. (2009). Research Methods in Human-computer Interaction (First ed.). Wiley Publishing.
Lund Research Ltd. (2013). Independent t-test using SPSS Statistics. Retrieved December 17, 2016, from https://statistics.laerd.com/spss-tutorials/independent-t-test-using-spss-statistics.php#procedure
Lund Research Ltd. (2013). One-way ANOVA in SPSS Statistics. Retrieved December 17, 2016, from https://statistics.laerd.com/spss-tutorials/one-way-anova-using-spss-statistics.php#procedure
MacKenzie, S.I. (2013, March 29). Within-subjects vs. Between-subjects Designs: Which to Use? Retrieved December 15, 2016, from http://www.yorku.ca/mack/RN-Counterbalancing.html
McDonald, J.H. (2014). Handbook of Biological Statistics (3rd ed.) Sparky House Publishing.
Morville, P., Arango, J., & Rosenfeld, L. (2015). Information Architecture For the Web and Beyond (4th ed.). O’Reilly Media.
Peyton, J. (2014, February 25). What’s the average bounce rate for a Website? Retrieved October 12, 2016, from RocketFuel, http://www.gorocketfuel.com/the-rocket-blog/whats-the-average-bounce-rate-in-google-analytics/
Rodden, K. (2015, December 2). How to choose the right UX metrics for your product. Retrieved October 12, 2016, from Google Ventures Library, https://library.gv.com/how-to-choose-the-right-ux-metrics-for-your-product-5f46359ab5be#.pzlpk5j5k
Rogers, Y., Sharp, H., & Preece, J. (2012). Interaction Design: Beyond Human-Computer Interaction (3rd ed.). John Wiley & Sons.
SPSS Tutorials (n.d.). Latest Tutorials. Retrieved December 15, 2016, from http://www.spss-tutorials.com/
Trochim, W.M.K. (2006, October 20). The T-Test. Retrieved December 15, 2016, from http://socialresearchmethods.net/kb/stat_t.php
Yatani, K. (2014, April 22). Statistical Methods for HCI Research. Retrieved December 17, 2016, from http://yatani.jp/teaching/doku.php?id=hcistats:start

It’s important to realise the limitations of the data. The default information collected by Google Analytics supports marketing decisions and doesn’t reveal much about UX related activities such as sentiment, motivation and intent. However, the scope of advanced techniques, such as eye tracking, is very narrow – it may assist in answering one specific research question only, as you have noted above. Before deploying advanced techniques, it is important to understand what data is available and what can reasonably be inferred from it. Through the process of hypothesis generation and evaluation, UX designers can identify what additional metrics need to be collected to validate or supplement Google Analytics data.
LikeLiked by 1 person
I agree, and as always evaluation methods should be carefully assessed depending on what the objectives of the study are.
LikeLike
Nice post Simon, In relation to Google Analytics I think the reporting is very much focused on digital marketing. To gain insights into UX I find making custom reports and goal funnels to be the best. Bounce Rate can be tricky too – if the user flow is to take them too a third party site bounce protection should be applied to reduce the bounce rate.
LikeLiked by 1 person